Not So Fast
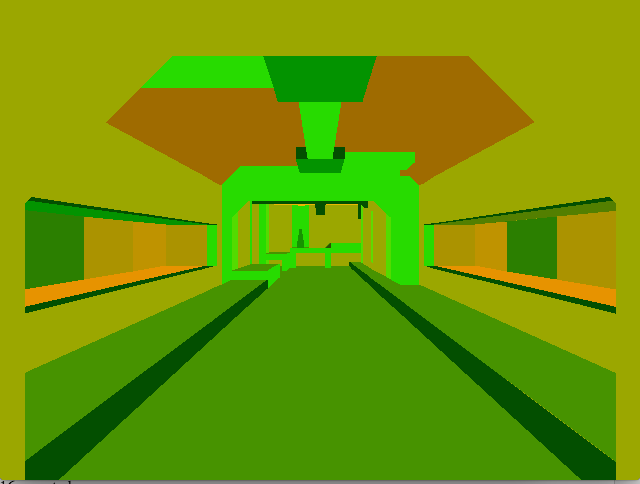
I wrote a custom engine to render Quake levels with my GPGPU. After fixing many subtle hardware lockups and compiler backend gremlins, I’m right chuffed to see this running reliably on an FPGA. It stresses a lot of functionality: hardware multithreading, heavy floating point math, and complex data structure accesses.
I won’t be challenging anyone to a deathmatch any time soon
But… it’s running at around 1 frame per second. While this is only a single core running at 50 Mhz, the original Quake with a software renderer ran fine on a 75 Mhz Pentium, so there’s a lot of room for improvement. I’ll dig more into the performance in a bit, but first, some background on how this works.
I investigated porting Quake to this architecture, but decided not to, at least for now. Quake has a software and an OpenGL renderer. Since the software renderer doesn’t support SIMD or multithreading, it would perform poorly on this architecture and wouldn’t yield useful performance information. I could have added an OpenGL API on top of the 3D rendering library I discussed in previous posts. However, Quake uses old school “immediate mode” OpenGL 1.1. It adds each vertex with a separate function call and performs state changes for each texture, which would be less efficient. Also, it seemed like a lot of work.
Instead, I wrote a new engine from scratch that renders the shareware Quake .PAK file and is optimized for this architecture. It packs all the textures into a texture atlas, which is relatively small given the era of the game (all the textures fit in a 1024x1024 atlas at the largest mipmap level).

The renderer also converts all the polygons in each leaf BSP node into a vertex attribute array so it can render a leaf with a single draw call. The rest of the engine works like the original. It walks the BSP tree to find which leaf node the camera is in, marks nodes from a precomputed potentially visible set associated with that leaf, and then walks the BSP tree from front to back, skipping unmarked nodes. I haven’t implemented lightmaps yet.
It takes around 40 million clock cycles for this engine to render a frame at 640x480 pixels, not including BSP traversal or frame setup, which is a tiny fraction of that. During that time, it executes around 22 million instructions, 0.55 instructions per cycle. While the hardware could be optimized, even the best case (for single issue) of one instruction per cycle would only run at a little over 2 frames per second. The bigger problem is the number of instructions that the engine needs to execute per frame.
That being the case, I could perform experiments in the emulator, which is instruction accurate but not cycle accurate. This allowed me to iterate faster. My first test was to bypass the pixel processing, hard coding it to color all pixels white. The program performs the same geometry processing and rasterization as the normal version, but skips the z-buffer check, parameter interpolation, and pixel shading. This brought the total instruction count per frame down to around 7.5 million instructions, eliminating about 66% of the instructions. Pixel processing is conveniently driven from one function, so I can instrument it with cycle counters–similar to Michael Abrash’s Zen Timer. The timer function looks like this:
int gLastCycles;

inline void checkpoint(char id)
{
    int elapsedCycles = __builtin_nyuzi_read_control_reg(6) - gLastCycles;
    printf("%c %d ", id, elapsedCycles);
    gLastCycles = __builtin_nyuzi_read_control_reg(6);
}
Calling __builtin_nyuzi_read_control_reg(6) returns the count of executed instructions in the emulator.
A common measure of rendering performance is how many cycles it takes to render each pixel. However, this architecture uses its wide vector unit to process up to 16 pixels in parallel (with each pixel in a vector lane), so that metric isn’t as straightforward. So, if it takes 160 cycles to shade 16 pixels, I could divide that and say it’s an average of 10 cycles per pixel.
The qualifier “up to” is important. There are common situations where it ends up shading fewer than 16 pixels.
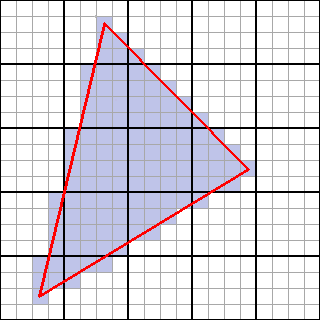
The rasterizer works by recursively breaking a triangle down to 4x4 groups of pixels, aligned on 4 pixel boundaries. It computes a 16 bit mask which indicates which pixels in that group the triangle covers. It then calls a function (which I’ll discuss shortly) to compute the color values for all 16 pixels in parallel using the vector unit. Lanes that aren’t covered by a pixel are unused for that call. This architecture can have up to 15 unused pixels in the worst case where the triangle only covers one pixel of the group.

Most GPUs process pixels in 2x2 chunks, so they may have up to 3 unused pixels. However the problem is worse on this architecture because of the larger grid.
The performance is easy to measure by instrumenting the function I mentioned earlier:
volatile int pixelsFilled;
volatile int fillMaskedCalls;

void TriangleFiller::fillMasked(int left, int top, unsigned short mask)
{
    __sync_fetch_and_add(&pixelsFilled, __builtin_popcount(mask));
    __sync_fetch_and_add(&fillMaskedCalls, 1);
The __builtin_popcount intrinsic returns the number of set bits in the mask, which is between 1 and 16.
The initial frame fills 434,670 pixels over 34,814 calls to fillMasked. Dividing that comes out to an average of 12.5 active pixels per call, meaning it utilizes 78% of the capacity of the vector unit (or, for glass half empty people, wastes 22% of the capacity).
Out of curiosity, I ran a test where I computed how many 2x2 blocks the rasterizer would have generated for the same scene at the top of fillMasked. This estimates how efficient a traditional GPU architecture would be for this scene.
if (mask & 0b0000000000110011) __sync_fetch_and_add(&totalQuads, 1);
if (mask & 0b0000000011001100) __sync_fetch_and_add(&totalQuads, 1);
if (mask & 0b0011001100000000) __sync_fetch_and_add(&totalQuads, 1);
if (mask & 0b1100110000000000) __sync_fetch_and_add(&totalQuads, 1);
The result is 118,621 quads. Dividing the total filled pixels by this results in 91% efficiency (3.64 pixels per quad on average).
I can use the checkpoint function I described above to break down the time in fillMasked. There are two paths through this function. One is an early out that occurs if the depth check fails for all 16 pixels (that is, all pixels are occluded by closer triangles). This path takes 68 instructions. This includes:
- Computing the reciprocal of the interpolated Z value, which perspective correction requires. This processor does not have a hardware floating point divider. Instead, it performs division by using Newton-Raphson approximation, which requires 9 instructions.
- Reading the depth buffer entries. Since there are 16 entries in a grid, this requires a 16 cycle gather load (which the emulator also counts as 16 instructions).
The early out path occurs 11,960 calls out of 34,814, or 34% of the time. The BSP sort from front to back makes this efficient. If the Z check does not early-out, the function breaks down as follows:
Phase
| Instructions | % total |
|---|---|---|
| Depth Check/Update |
88
|
13%
|
| Parameter Interpolation |
189
|
29%
|
| Shading |
305
|
46%
|
| Color pack/writeback |
69
|
10%
|
That’s 651 instructions total. Dividing by 12 pixels shaded on average per call, computed above, yields 54 instructions per pixel. That’s a lot.
Close to half of this is in the shader, and a large portion of that is texture sampling, which is done completely in software. Using the instruction timer shows that reading the texture (which also returns 16 pixels at a time) requires 265 instructions per call. If I turn off texture sampling, the frame renders in around 16 M instructions, 27% faster. In this configuration, each call to fillMasked takes 386 instructions, or 38 instructions per pixel on average. That’s still quite a bit, but makes a strong argument to investigate hardware texture sampling.

I’ve done a bunch of algorithmic improvements to the renderer, including:
- Skip parameter interpolation for Z-rejected pixels (9% faster)
- Compute step vectors once per surface instead of for each triangle (0.8%)
- Skip perspective interpolation if a parameter is constant (2.6%)
- Perform better triangle/bin intersection test before setting up interpolators (0.7%)
- Invert interpolant gradient matrix once per triangle instead of for each parameter (0.5%)
- Pass tile size in rasterizer as a shift amount of instead of pixels, avoiding multiply (0.2%)
- Avoid initializing shader state for each triangle (0.4%)
- Cache stride pointer for render buffer (0.8%)
It’s clear that I’m getting to the point of diminishing returns. The bigger problem is that common operations take too many instructions. For example, it takes 69 instructions above to convert the colors, which are represented by a floating point value per color channel (RGBA) into the native framebuffer format, a packed 32 bit integer. That seems like a lot, but I’ll quickly skim over this operation to show how these add up:
Each color channel (red, blue, green) it calculated in floating point. These need to be clamped to fit in the range 0.0 to 1.0, multiplied by 255, and converted to an integer:
veci16_t rS = __builtin_convertvector(clampfv(color[kColorR])
    * splatf(255.0f), veci16_t);
Which assembles to (repeated for each of three channels):
    cmpgt_f s0, v0, s25    # > 1.0?
    move_mask v0, s0, s25  # yes, set 1
    load_32 s0, -336(pc)   # load 0.0
    cmplt_f s1, v0, s0     # < 0.0?
    move_mask v0, s1, s0   # yes, set 0
    load_32 s1, -344(pc)   # load 255.0
    mul_f v0, v0, s1       # multiply
    ftoi v0, v0            # convert
Then the values need to be packed together into 32 bits:
pixelValues = splati(0xff000000) | rS | (gS << splati(8))
    | (bS << splati(16));
Which assembles to:
    shl v1, v2, 8        # gs << 8
    or v1, v4, v1
    shl v0, v0, 16       # bS << 16
    or v0, v1, v0
    load_32 s0, -792(pc) # 0xff000000
    or v0, v0, s0
Finally, this needs to be stored back to the frame buffer at the appropriate location. This requires some math to compute the frame buffer address:
fTarget->getColorBuffer()->writeBlockMasked(left, top, mask,
    pixelValues);

void writeBlockMasked(int left, int top, int mask, veci16_t values)
{
    veci16_t ptrs = f4x4AtOrigin + splati(left * 4 + top * fStride);
    __builtin_nyuzi_scatter_storei_masked(ptrs, values, mask);
}
Which assembles (inlined) to:
    shl s0, s26, 2                # left * 4
    load_32 s1, 4(s27)            # fTarget
    load_32 s2, (s1)              # getColorBuffer()
    load_32 s1, 200(s2)           # f4x4AtOrigin address
    load_v v1, (s2)               # load f4x4AtOrigin
    load_32 s4, 60(sp)            # top
    mull_i s1, s1, s4             # top * stride
    add_i s0, s1, s0              # (left * 4) \+ (top * stride)
    add_i v1, v1, s0              # 4x4AtOrigin \+ above
    store_scat_mask v0, s24, (v1) # store pixels...
And so on… all these instructions add up. I think I could improve this by structuring the code better. There are a lot of redundant coordinate conversions and address calculations. Instance variables and constants are reloaded for each call to fillMasked. The overhead calling this function for each 4x4 block is not function dispatch itself, but recreating the state each time.
One thing I’m considering is eliminating the fillMasked function. The rasterizer, rather than calling a function each time it computes coverage for a chunk of pixels, would build a list of coverage masks for the entire tile. The program would then loop over that structure, filling in the tiles. This would allow caching many of the variables that currently need to be reloaded for each fillMasked call. Coordinate conversions and address calculations that currently require a number of multiplies could be replaced with cheaper increments in the loop.
This would also potentially allow me to get better vector utilization by repacking 2x2 blocks from multiple partially covered 4x4 blocks. This would require only 29,655 4x4 blocks (118,621 2x2 ÷ 4) blocks per frame, compared to 34,814 for the unpacked implementation, a 15% improvement. However, there is overhead for the packing calculations, which could cancel some or all of the gains.
It also seems like adding instructions that perform color channel packing and unpacking could also be useful.