Improved 3D Engine Profile
I reworked the 3D renderer recently, improving performance and adding features to make it more general purpose. This included improved bin assignment to reduce overhead, tracking state transitions properly, and adding features like clipping.
Software Renderer Design
Like previous revisions of this 3D engine, Tiled Rendering is used. The screen is broken into 64x64 pixel squares. These are assigned dynamically to hardware threads, which render each tile completely before moving to the next one. There are multiple tiles in-progress at a time. This video shows this in action in the emulator with four threads.
Tiled rendering has a few advantages:
- External memory bandwidth The framebuffer is larger than the cache. If triangles were rendered in the order they were submitted, the cache would most likely thrash. In a tiled renderer, the active set of tiles fits entirely in the cache. Each byte in the framebuffer is ideally written to external memory only once.
- Scaling In order to fully utilize cores/threads, the workload needs to be divided into smaller tasks. Tiles are a convenient unit of work. The advantage of this approach is that there is no need for synchronization between threads while the tile is being rendered, since the tiles are non-overlapping. If the work was divided some other way (for example, having each thread process a triangle), synchronization would be required to ensure overlapping pixels were drawn in the correct order. My earlier attempts at building a non-tiled engine showed that synchronization overhead can be significant.
Each frame is rendered in two phases. The first performs vertex and triangle setup, and the second fills the tiles. Since every triangle that overlaps a tile is rendered before moving to the next one, the geometry phase must be complete before the pixel phase begins.
Geometry phase
- Fetch vertex attributes and run the vertex shader on them. Vertices are broken into groups of 16, which are dispatched dynamically to hardware threads. Each thread calls a vertex shader callback, which is vectorized and works on all 16 vertices at once. This means there are up to 64 vertices in-flight per core (four threads times 16 vertices).
- Triangle setup. This is also divided between threads on a first come,
first serve basis. It is not vectorized because it deals with a lot of data
structures.
- Near plane clipping - Ensure there are no negative Z values, which would mess up perspective calculations. This operation may split triangles into multiple smaller ones.
- Backface culling
- Perspective division
- Conversion from screen space to raster coordinates
- Binning. An axis-aligned bounding box test is used to determine which tiles a triangle potentially overlaps. Each tile has an list of triangles (actually a linked list of arrays), which is used by the next phase. Lock-free algorithms are used to quickly allocate data structures and insert them into the tile lists.
Pixel phase
Each thread grabs the next unrendered tile and renders all triangles in its list. It performs the following steps:
- Sort triangles. Since triangles are processed in parallel, multiple threads can insert triangles into the same tile list. This means they may not be in the order that they were originally submitted. The thread first performs an insertion sort to address this. Note that the tile list is _mostly _in order, so an insertion sort is generally more efficient in this situation than many other algorithms.
- Clear tile to background color
- Rasterize triangles. This algorithm
uses half plane equations and recursively divides the tile into 4x4 grids,
taking advantage of the vector unit to update the equations for all points
simultaneously. When it gets to the smallest level (4x4 pixels), it performs
the following steps with each pixel represented in one lane of the vector (up
to 16 at a time)
- Depth buffer/early reject
- Parameter interpolation - The parameters that were computed per-vertex by the vertex shader are interpolated for all pixels in-between. This is done in a perspective correct manner.
- Pixel shading - As with the vertex shader, this is configurable via function pointer and can be set per draw call.
- Blend/writeback
- Flush tile back to system memory - loop over all overlapped cache lines and invoke flush instruction on each address.
Performance
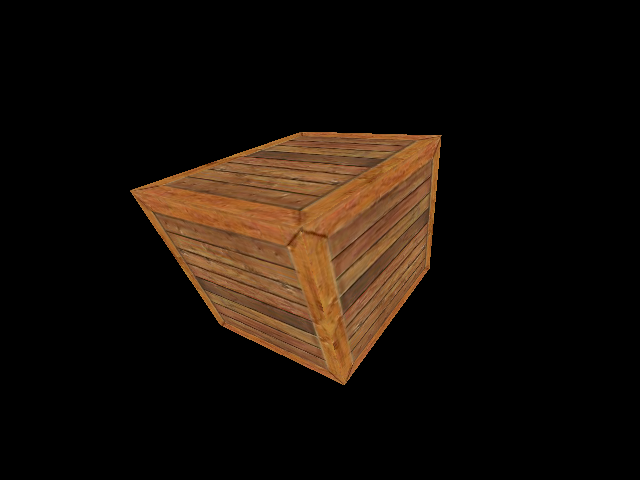
I’ve generated profiles with two workloads with different performance characteristics. The first is the teapot that I’ve used for many previous experiments. It has ~2300 triangles and Lambertian shading. The second example is a cube with bilinear filtered texture mapping. The texture is 512x512 pixels and fits in a megabyte of memory (4 bytes per pixel). This is large for an individual texture, but simulates the common case of the texture working set for a frame being larger than the cache. The L2 cache is configured as 128k, and the L1 instruction and data caches are each 16k.

Basic Metrics
Here is the values of internal performance counters:
| Benchmark | Teapot | Texture |
| Total Cycles | 13226183 | 6809062 |
| l2_writeback | 49878 | 54436 |
| l2_miss | 57592 | 121725 |
| l2_hit | 899089 | 333559 |
| store rollback count | 343268 | 163497 |
| store count | 1204554 | 436648 |
| instruction_retire | 7966800 | 3132816 |
| instruction_issue | 8977614 | 3997187 |
| l1i_miss | 407 | 452 |
| l1i_hit | 12279560 | 5607283 |
| l1d_miss | 112458 | 183195 |
| l1d_hit | 1747645 | 805244 |
- The percentage of cycles for which an instruction is issued for the teapot test is about 68%. The texture test is around 59%, ostensibly because it is spending more time waiting on texture fetches from memory. There is an opportunity to increase performance by improving issue utilization, perhaps with more threads or other microarchitectural improvements.
- About 11% of issued instructions for the teapot test are squashed, either because of a cache miss or branch. The figure is 27% for the texture test.
- The L2 cache miss rate is around 6% for the teapot test and 27% for the texture test. The latter is not surprising, because the texture is large.
Breakdown by Stage
In order to analyze the execution of these benchmarks, I used a very sophisticated profiler that is built into the compiler: I commented out chunks of code and measured the difference in execution time. :) Since each stage in the rendering pipeline depends on the results from the last, I worked backwards, tabulating total clock cycles in a spreadsheet:
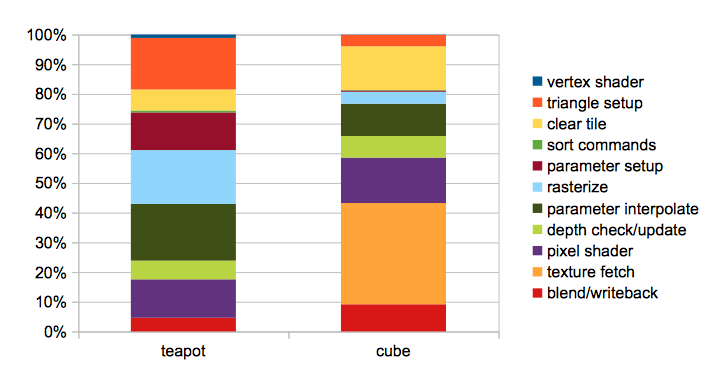
A few observations:
- In both cases, vertex shading (which includes fetching the vertex attributes from memory) appears to be negligible compared to other parts of the rendering process. Fixed function GPUs have dedicated hardware to fetch vertices.
- Blend and writeback is a relatively small part of the overall load. This was a bit of a surprise to me. The color components computed by the shader are stored using a floating point value per channel. There are a series of multiplies, conversions, clamps, shifts, and masks to get them packed into pixels. I had originally considered adding specialized instructions to perform these operations more efficiently. This step also flushes the data from the cache by looping over the tiles and issuing a flush instruction for each cache line, which seemed inefficient. I considered finding a way to accelerate this in hardware. While it’s possible that the measured overhead in this use case is lower because the entire screen isn’t covered in these tests, it doesn’t seem like there’s a win doing much optimization here now.
- Parameter setup and interpolation (dark red and green bars) are fairly expensive in both cases. I think these operations require a floating point pipeline, so it’s not clear to me that a dedicated interpolator would have a significant area advantage over using the cores to compute them.
- Texture fetch is very expensive, and some kind of hardware acceleration seems appropriate (the Larrabee paper stated this as well)
Scalability
The intent of this architecture is to be able to get good performance by throwing a bunch of cores at the problem. I ran a render test with varying numbers of cores to determine how much performance increases as the number of cores was increased.
The number of cores will also increase the L2 working set size. I didn’t want this to be a factor, but rather to focus on other microarchitectural bottlenecks, so I configured a 4MB L2 cache and 32k L1 data and instruction caches for this test. This is configured with four hardware threads per core.
The test program I used was the ‘clip’ test. I used it because it covers the whole screen, and thus should scale better than the tests in the previous section, which render to a small number of tiles in the middle of the screen. The checkerboard is computed programmatically in the pixel shader and does not use a texture. The geometry for this is the inside of a cube, so the vertex calculations have low overhead.

This chart shows the relative speedup as cores are added. The orange line
shows a linear speedup for reference. 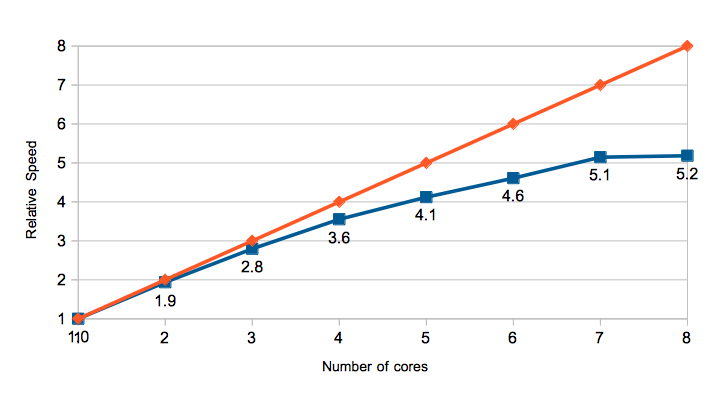
There are most likely two reasons why performance saturates. First, there is more lock overhead. This primarily occurs:
- Where lock-free atomic operations are used to access shared data structures. When the ‘store synchronized’ instruction that is the fundamental primitive for these operations detects another thread having updated the variable, it must loop and retry.
- Where the threads spin at the end of a phase to wait for others to finish. Spinning in general is very bad, because it steals issue cycles from other threads.
Running the same program in the emulator with 4 and 32 threads, the latter issues 28% more instructions overall. These are presumably synchronization instructions. Traditional GPUs have a fixed function scheduler.
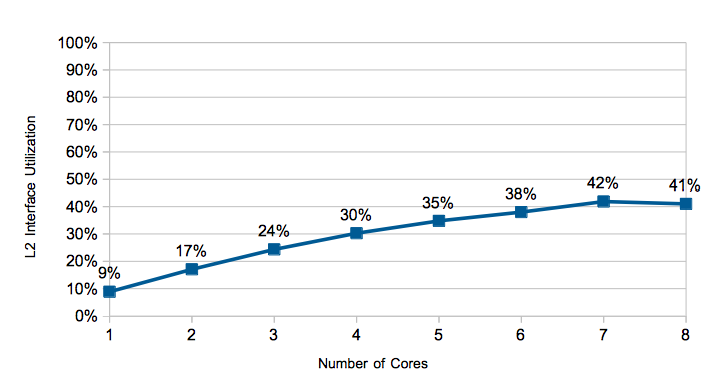
The second area to look at is the interconnect. The L2 cache is shared by all cores and is a potential bottleneck. This graph shows what percentage of cycles new requests are queued into the L2 pipeline. The interface is not saturated, and interestingly falls off at 8 cores, presumably because some other bottleneck has begun to degrade performance.
This graph shows the average amount of time hardware threads spend in various states. As expected, the amount of time waiting because the store buffer (orange) is full increases as the number of cores increase, a consequence of the write-through design.
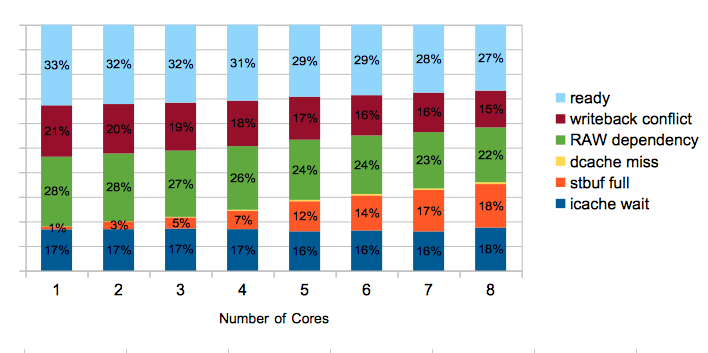
Because this is not doing texturing and the caches are fairly large, the dcache miss time is negligible.
Conclusions
This analysis didn’t turn up any smoking gun bottlenecks, but plenty of areas for further investigation. Some of the areas that intuitively seemed like they would be expensive, such as pixel writeback, turned out to be relatively minor. Other areas, like texture sampling, were obvious areas for hardware improvements, and the data confirmed this.