Memory Access Visualization
It is difficult for the human mind to comprehend large differences in magnitude, and we often forget what large magnitudes exist within computers. Even creating graphics to effectively display these differences can be challenging. I’ve generated some visualizations of memory access patterns of a test program running on my GPGPU design, which renders a cube with bilinear filtered textures applied to the sides. There are four hardware threads, each of which renders a 64x64 tile at a time. The program requires around 1.6 million instructions to complete, performs around 500k memory accesses, and uses 2.25 Mb of working RAM.
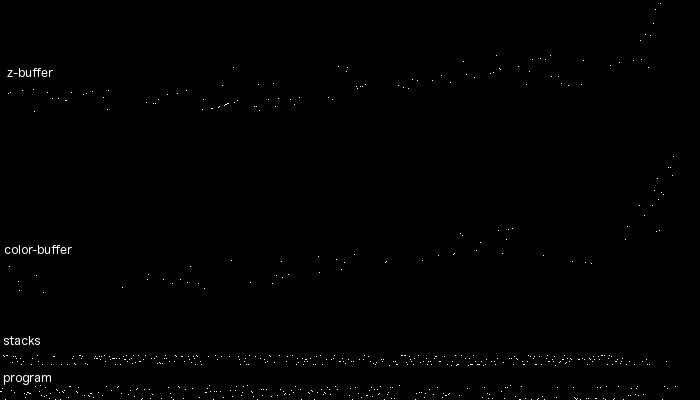
In the first visualization, I’ve attempted to show memory accesses for the complete program execution. The vertical axis represents memory addresses (ascending towards the top) and the horizontal axis represents time. A white pixel represents a memory access. This image is 700x400 pixels. This is far to small to display every access, so I’ve needed to compress scale quite a bit. Each pixel vertically represents 368 bytes and horizontally represents 800 memory accesses–a pixel is colored white if any access occurs in this time/region. At this level, some interesting high level details is visible. Since the engine renders left to right, top to bottom, we can see the access patterns move from low to high addresses from left to right in the color and z buffers. We can see heavy memory accesses in the program and stack areas (note that the program area also contains read only geometry and texture data)
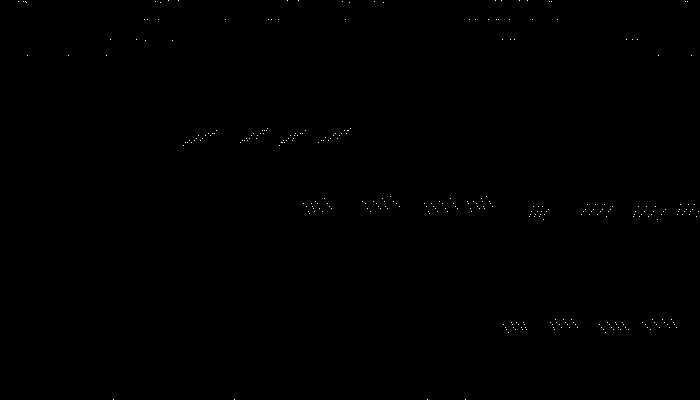
In the next diagram, I have zoomed in so that each pixel horizontally represents one memory access. The entire trace here is represents one pixel horizontally of the image above. I’ve also expanded the vertical scale a bit so only the program accesses are shown (the band at the low portion of the screen). Some interesting patterns emerge that were not visible in the zoomed out trace presented originally. We can now see that there are multiple threads running: this is especially evident in the patterns at the lower right hand corner of the image. If you look closely, you will notice each cluster has four dots representing instruction accesses for the four threads. They all appear to be running in the same general proximity, but not the same code address. The patterns are caused by the threads marching forward in lockstep. The gaps between the horizontal bands indicate branches. The scattered dots on the top are accesses to global data structures or read-only data.
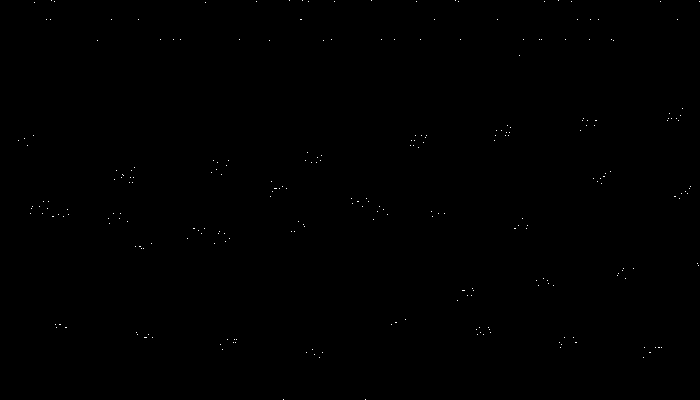
In the next diagram, I’ve zoomed out a bit. The vertical scale is the same, but the horizontal scale now represents 10 memory accesses. A different pattern emerges, with many small clusters. The branches occur more frequently across the horizontal scale now, which causes more vertical separation:
Zooming out to 100 memory accesses per horizontal pixel and equivalent vertical scale, form begins to disappear and the display looks more like a random bunch of dots.

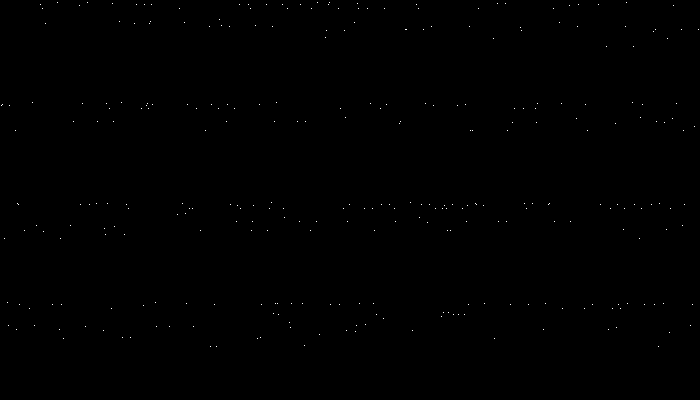
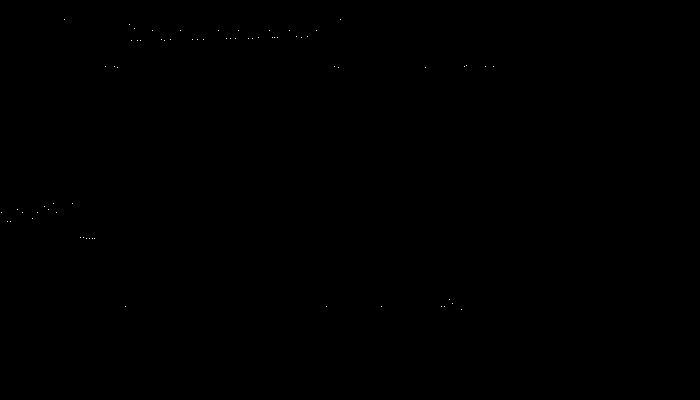
Now I’ve zoomed in on the stack area, which is the next band up in the original diagram. In this case, I’m viewing the entire stack area, with 100 memory accesses per pixel horizontally. We can now see that there are four stacks (for the four hardware threads):
Zooming in even closer so the vertical axis covers only one thread and the horizontal axis represents one pixel per memory access, we can start to see interesting stair step patterns of accesses, which represents function calls (callee-saved registers must be stashed on each call, and registers may need to be spilled and reloaded). The display seems to stop abruptly at the right side of the trace. The thread presumably is in an inner loop inside of a function and working completely within registers, this not requiring stack accesses:
Although most programmers probably have intuitive mental models they use to imagine how programs access memory and caches, the visualizations here demonstrate how complex program behavior can be (and this is a relatively simple program compared to something like a web browser or operating system). It suggests that a single mental model is probably not sufficient and that thinking about behavior at multiple timescales and in terms of different memory regions may be a better way of understanding it.